What is an Action Score?
It's our scoring system based on the Quality (Q),Value (V) and Growth (G) principle.
The Action Score is the average of Q,V and G.
And if a stock has a high Q,V,G score, it means it is worth "taking action".
The purpose is to allow it to do all the heavy lifting of finding stocks for you. Instead of going through blocks of stocks before you find one that is worth investigating, the high Action Score stocks will have ideas for you right away.
I spent 1 year with a math professor to study, analyze, and determine what factors work. I'm not after the typical low PE and PB type metrics. I use off the charts metrics and ratios that Wall Street won't use.
If you don't need the details of how it works, head over to "OSV Ratings" from within OSV Online app.
Otherwise, continue on.
Here is what we look for in a stock.
Quality Score
- PIOTROSKI SCORE: Higher the better. Signals fundamental strength and used as a preliminary filter to demote low Piotroski score stocks.
- FCF/Sales: Signals cash generation ability and efficiency. FCF/Sales has to be positive.
- CROIC: signals competitive advantage and management effectiveness. CROIC between 23% to 40% is the best range and receives highest scores.
Value Score
- PIOTROSKI SCORE: Higher the better. Signals fundamental strength and used as a preliminary filter to demote low Piotroski score stocks.
- EV/EBIT: one of the best valuation ratios to identify cheap stocks. Best range is less than 11.
- P/FCF: biggest impact to the score with the best values being less than 10.
- P/B: acts as a cleaning filter to remove shell stocks and darling stocks. P/B has less relevance than the early days so the weighting is lowest.
Growth Score
- PIOTROSKI SCORE: Higher the better. Signals fundamental strength and used as a preliminary filter to demote low Piotroski score stocks.
- SALES CHANGE%: must be positive to seek growing companies within the last year.
- 5YR SALES CAGR%: must be positive to eliminate perennial losers inconsistent companies.
- GROSS PROFIT to ASSETS: measures the growth of profitability. In other words, are the assets profitable? A GPA of 0.5 means the company is generating profits of $0.50 for every dollar of assets.
As you can see the Piotroski score plays a big role in the initial rankings. The desired Piotroski range is 7-9.
That is why you will come across a stock where the other value numbers look better, but wonder why it has a low value score. A low Piotroski is the reason.
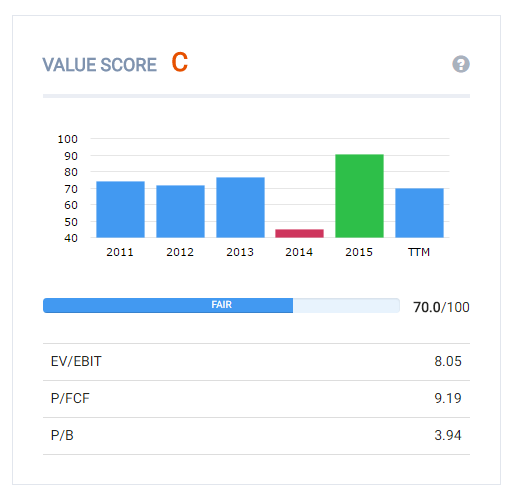
Look at Apple (AAPL)
Very good value metrics.
Now look at Nordstrom (JWN).
JWN may look slightly more expensive but it has a much better value score than AAPL.
Why?
The Piotroski. Apple has a Pio score of 5. Nordstrom is 8.
To see backtested results over a 17 year period, check out my results here.
That's the basics of the Action Score.
